Observing the growth status of cultivated crops is the fundamental and duty of the farmer.
All living things are expressing their current conditions and what they need for their health with their bodies.
However, even experienced farmers cannot fully understand their crops by simply looking at them.
Scientific agriculture starts with measuring, recording, and analyzing the condition of crops exactly as people take pictures
in hospitals and measure their bodies.
Cultigroth diagnoses the current state of the crop to help increase productivity and quality.
It compares and diagnoses growth conditions through visualization charts that analyze growth data,
and supports the establishment of an optimal cultivation strategy.
It also enhances the crisis management ability of farms through guidance on disease diagnosis and circumstances.
Why should I use cultgrowths?
To balance the environment according to the signals sent by the crop,
you need to know the current state of the crop and balance it.
These activities eventually show results in crop growth, which returns to production.
All farmers know this, but less than 0.01% of farmers check their own growth.
We affirm that if we check and thoroughly record the state of crops on the farm, the production or quality will surely be superior.
This is supported by the fact that all farms in the Netherlands,
an agricultural powerhouse, consider growth surveys as one of the most important tasks.
Cultigrots examine growth to the standard, digitize it with photos,br class='mo_dn' />and show the user to know the condition of the crop in a convenient form.
Key Features of Cultigross
- Function1
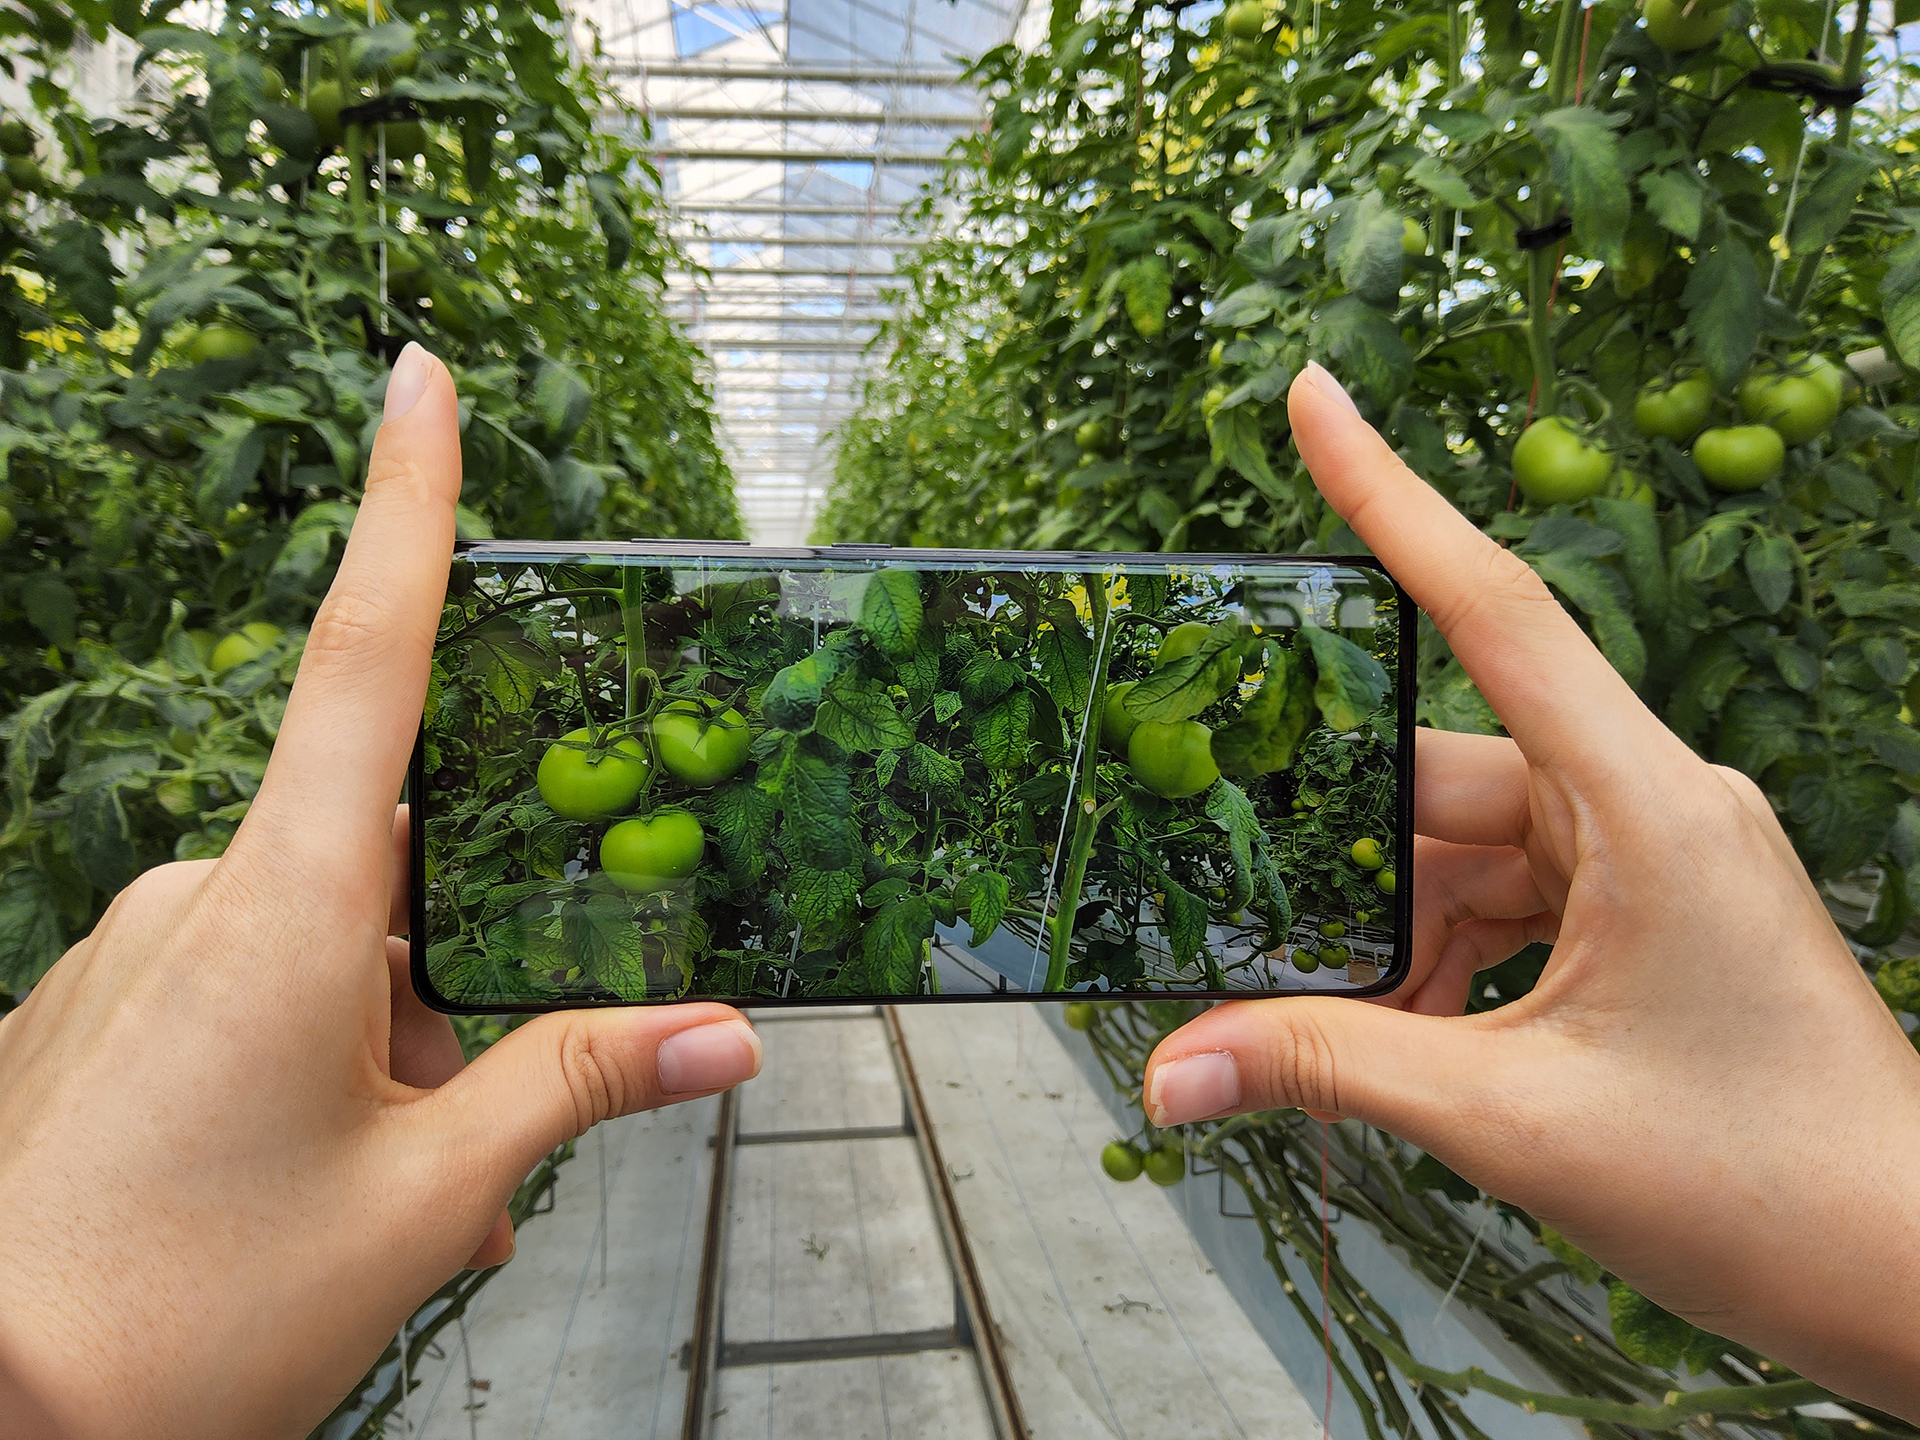
automatic measurement
Growth data is automatically extracted and stored in a data server simply by photographing the growth indicators of crops with a smartphone according to the guide.Currently, automatic measurement of growth indicators is possible for the four major smart farm crops: strawberries, tomatoes, paprika, and cucumbers, and the types of target crops will be further expanded in the future. - Function2
hand-measurement
Growers who want to measure by hand no longer need investigative fields, paper, or pencils for growth investigations.Real-time diagnosis and analysis are possible by entering hand-measured data directly into a smartphone or pad at the site and transmitting it to the cloud. - Function3
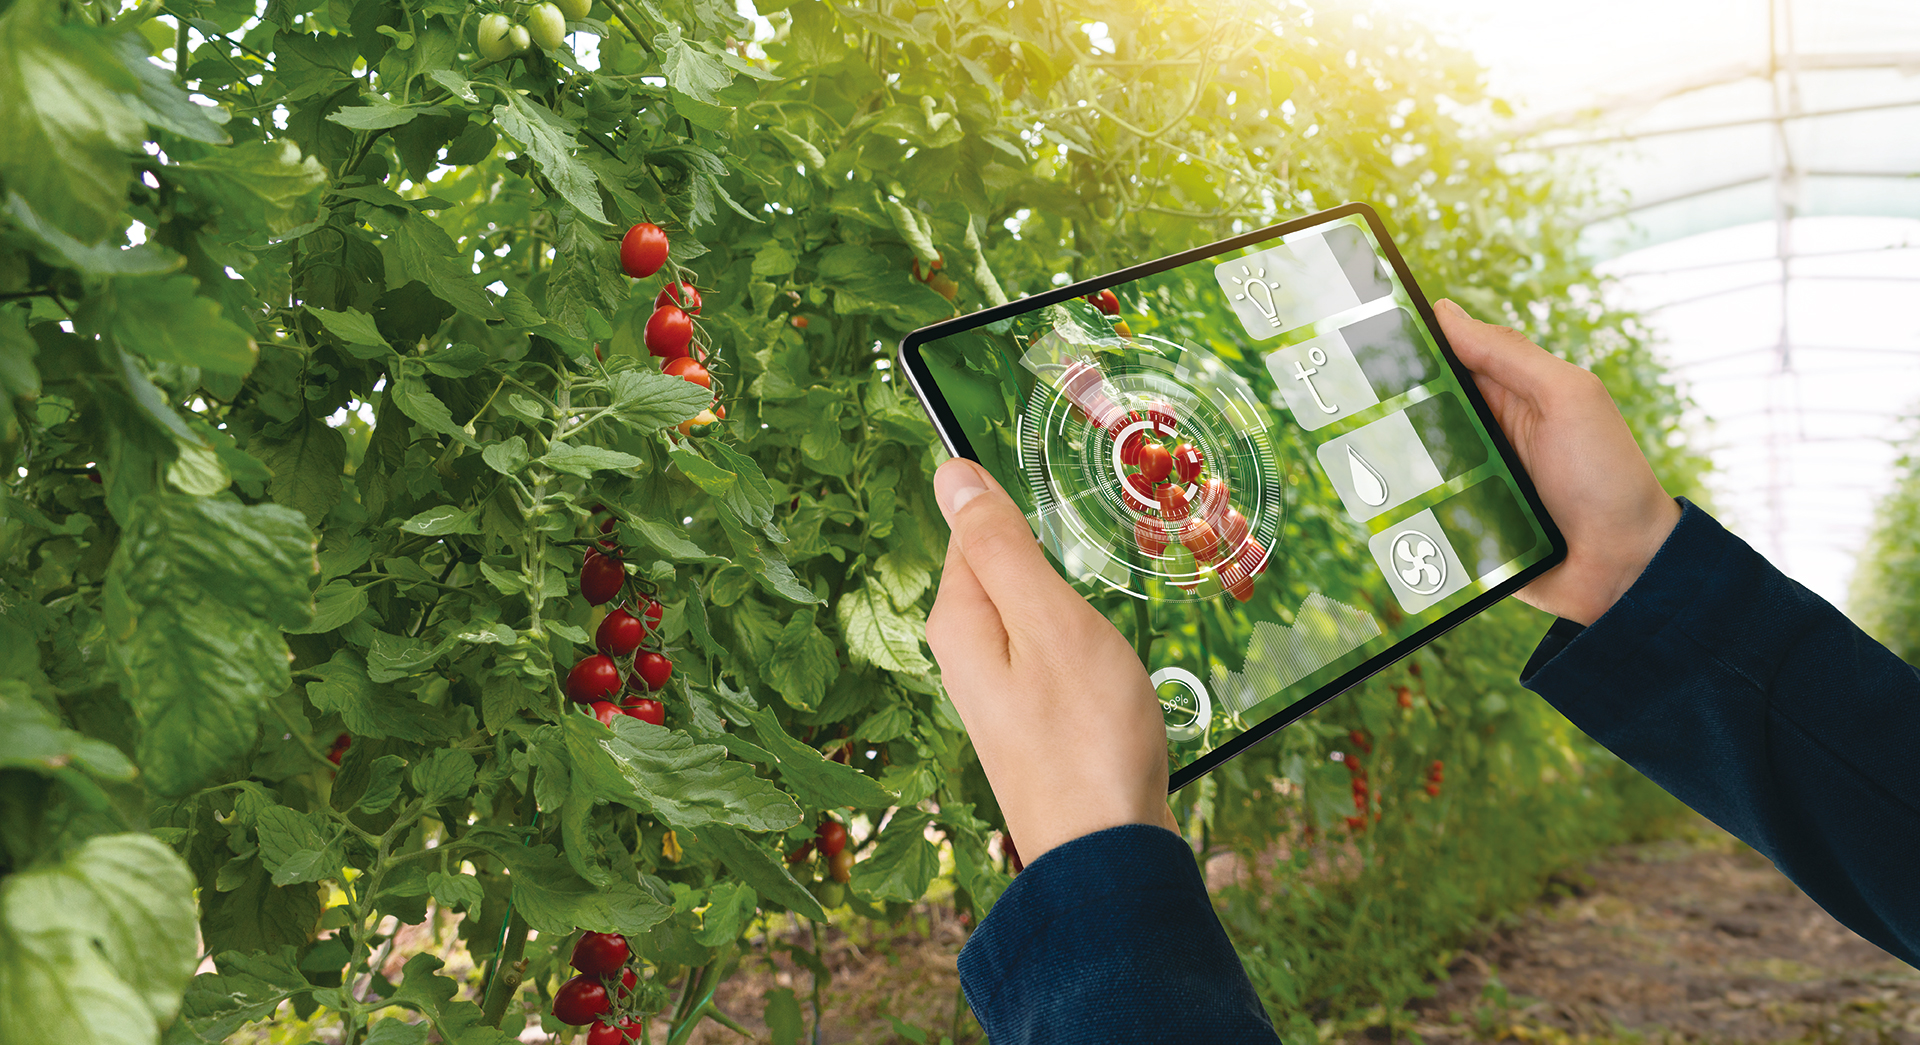
Visualization Chart
It provides a visualization chart that allows you to see at a glance the growth status of each week and changes in growth by week. - Function4
Expansion of the crop subject to measurement diagnosis
In the future, target crops that can automatically measure growth indicators and input them by hand will continue to expand.Now, I hope you start scientific farming with cultigros.
지원
여러분들의 농장의 재배과정을 디지털화하고 수익을 올릴 수 있는 방법에 대해 도움을 드리겠습니다.
여러분들에게 가장 적합한 컬티랩스 서비스와 제품을 선정하고 운용하는데 도움을 드리겠습니다.
어떻게 지원해드릴까요? 아래 문의를 작성해주시기 바랍니다.